Closed Sales
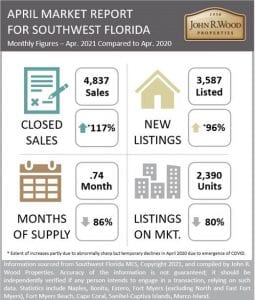
April posted 4,837 closed sales, over double that for April of last year when an abnormally low 2,234 sales were posted due to the initial impacts of the pandemic. Comparing April 2021 sales with the average for April 2017, 2018, and 2019, sales were up 74% from 2,774 to 4,837. On a 12-month rolling basis, sales through April 30 were up 40.8% from 27,658 to 38,942.
Listing Inventory / New Listings
As of April 30, 2021, there were 2,390 properties on the market, down 79.8% from the same date last year when 11,801 properties were available. Months of supply as of April 30 was under one month, at .74, down 85.6% from last year when 5.12 months was posted. New listings for April were up 95.4% from last year, mainly due to last April’s sharp but temporary drop in new listings due to uncertainty about the pandemic at that time. However, at 3,587, new listings for April 2021 were consistent with the 3,670 average for April 2017, 2018, and 2019. On a 12-month rolling basis, new listings were up 1.7% from 38,149 to 38,800.
Average Selling price
For the 12-month period through April 30, the average selling price was $557,227, up 23.15% from the preceding 12-month period when a $452,496 average was posted.
Summary
We’ve experienced a steady decline in standing inventory over the past year; however, the rate of that decline has started to decrease in recent weeks. This is due in part to a modest increase in new inventory entering the market over the past few weeks when compared to typical patterns for this time of year. With standing inventory still in short supply, it is this increase of new inventory that is helping satisfy continued strong buyer demand

Click here for detailed report


