Closed Sales
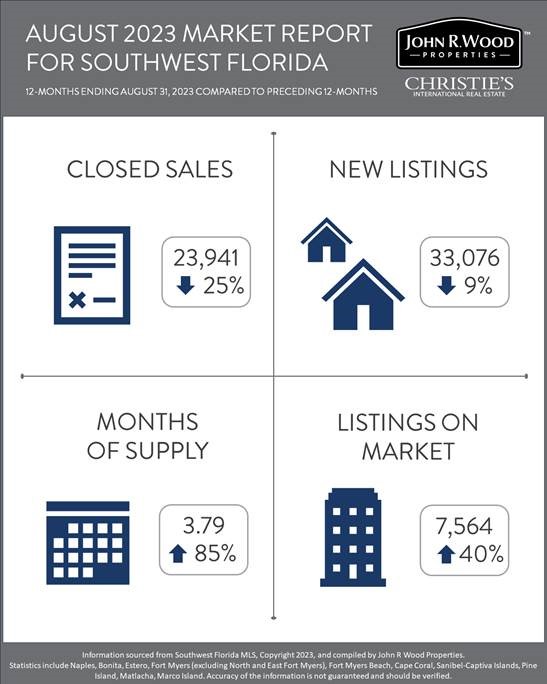
Closed sales for the 12-month period ending August 31, 2023 were down 25% from the preceding 12-months, from 31,726 to 23,941. The 1,945 sales posted for the month of August were down 2% when compared to August of 2022.
Listing Inventory / New Listings
As of August 31, 7,564 properties were available, up 40% from the same date last year and static compared to the prior month. New listings for the 12-month period ending August 31 were down 9% from the preceding 12-months, from 36,467 to 33,076. For the month of August, new listings were down 1% from the same period in 2022. 3.79 months of supply was posted as of August 31, up 85% from August 2022 when months of supply was an unusually low 2.05 months, and unchanged from July 2023.
Average Selling Price
The average selling price for the 12-month period through August 31 was $795,912, up 7% from the preceding 12-month period when the average selling price was $746,900.
Perspective
Closed sales during the month of August fared well, posting a 9% uptick over July and a mere 2% shortfall compared to August of last year. Offering welcomed additional options for buyers, new listings posted month-over-month and year-over-year increases, at 5% and 1%, respectively. However, due to the steady pace of sales, standing inventory remains low from a historical standpoint with 7,564 units on the market as of August 31st, up 40% of one year prior, but still well short of the 10,000+ that was typical for this time of year prior to the pandemic-induced buyer surge. Due to continued steady demand and a tight inventory that’s increased little in recent months, and in spite of interest rates having edged up, closed sales prices have continued to rise year-over-year, but at a slower rate than during the height of the market.
Click here for the full report


