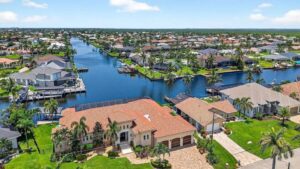
A sobering reality check has hit the Southwest Florida real estate ecosystem, exposing pockets of deep financial stress despite broader pockets of corporate resilience. According to the Mid-Year 2026 U.S. Foreclosure Market Report released by premier property data firm ATTOM, the Punta Gorda foreclosure rates have surged to the absolute highest position in the United States.
The comprehensive analytics report, which pulled data from more than 3,000 counties covering over 99% of the domestic population, tracks all primary stages of distressed real estate, counting default notices, scheduled public auctions, and bank repossessions (REO). While economists view the expanding volume as a gradual return to historical pre-pandemic norms rather than a systemic structural crash, the data highlights a compounding affordability crunch impacting local working-class households.
Analyzing the Concentrated Distress Across Florida Metros
The primary revelation driving the midyear housing brief centers on Florida’s outright dominance in distressed real estate listings. Driven by an accumulation of high homeowners insurance premiums, escalating utility costs, and stubborn inflation layers, the Sunshine State posted the nation’s worst overarching statewide foreclosure rate, settling at 0.27% of all housing units representing roughly one out of every 373 homes.
The metropolitan breakdown reveals that the localized Punta Gorda foreclosure rates anchor a wider regional cluster of distressed assets:
-
Punta Gorda MSA (Worst Nationally): The waterfront market logged a nation-leading 0.50% foreclosure rate across its total housing units during the six-month window.
-
Lakeland MSA (Second Worst): Situated just north in Polk County, this inland hub followed closely behind with a striking 0.48% foreclosure rate.
-
Cape Coral MSA (Sixth Worst): Right here in Lee County, the high-density market registered a 0.35% foreclosure filing rate.
-
Jacksonville and Ocala MSAs: Tied further down the tracking ladder, both regional nodes posted 0.31% filing rates.
Comparing Year-Over-Year Macro Contractions
The acceleration of these defaults indicates that the quiet post-pandemic period has officially drawn to a close as lenders aggressively move to clear their backlogs. Across the state of Florida, the first half of the year yielded a total of 27,494 properties with active foreclosure filings, marking an intense 32.7% surge compared to the exact same timeframe last year.
On a national scale, the trend lines move in a similar upward direction, though at a slightly slower velocity. The United States registered a total of 227,548 properties in distress, representing a 21% annual climb.
Crucially, ATTOM CEO Rob Barber noted that while filings are accelerating, the average timeline required to completely finalize a standard foreclosure dropped to 563 days. This represents the lowest timeline level recorded since 2013, proving that lenders are executing faster resolutions to repackage distressed inventory back onto the open market.
The Domino Effect on Housing Inventory and Local Building
This sudden influx of distressed properties introduces an additional layer of complexity for the construction industry and volume homebuilders. The accumulation of pre-foreclosure defaults and bank repossessions adds cheap, immediate alternatives to the existing standing housing pool.
This rising availability of resale inventory directly undercuts the need for ground-up development. To see how these real estate dynamics are forcing volume production builders to scale back their operations on the ground this season, you can review our comprehensive analysis of the Southwest Florida home construction permits decline to monitor shifting developer strategies.
Mid-Year 2026 Foreclosure Tracking Grid
Homeowner Advisory: Homeowners facing active default notices or Lis Pendens filings are highly encouraged to review state-backed mortgage counseling lifelines immediately, as high equity levels still leave strong windows open for successful short sales before an auction triggers.
| Geographic Territory | H1 2026 Foreclosure Rate | Total Individual Property Filings | Year-Over-Year Filing Shift |
| Punta Gorda MSA | 0.50% of Housing Units | Local Component Metric | Top Ranked Metro Nationally |
| Cape Coral MSA | 0.35% of Housing Units | Local Component Metric | 6th Ranked Metro Nationally |
| State of Florida | 0.27% of Housing Units | 27,494 Distressed Properties | Increased by 32.7% |
| United States Total | 0.16% of Housing Units | 227,548 Distressed Properties | Increased by 21.0% |
For granular county-level filing registries, interactive local default maps, or to read the full historical data breakdown, industry analysts can evaluate the metrics hosted on the Official ATTOM U.S. Foreclosure Market Data Repository.