The landscape of Port Charlotte is set for a sophisticated transformation following the February 25, 2026, approval of Tarpon Waterfront Village Charlotte County. In a 4-1 vote, Charlotte County commissioners greenlit the 110-unit condominium development, situated on a sprawling 20.33-acre site adjacent to the prestigious Charlotte Harbor Yacht Club.
Refining the Vision: Scaled for Community and Preservation
The final approval of Tarpon Waterfront Village Charlotte County comes after a series of revisions aimed at balancing density with environmental stewardship. Developer Jeffrey DiLaura, who also serves as director of the Charlotte Harbor Yacht Club, worked closely with county officials to scale back the project’s original footprint.
Evolution of the Project:
-
Original Plan: 156 units across six 65-foot buildings.
-
Intermediate Revision: 120 units in four buildings.
-
Final Approved Plan: 110 units designed to maximize sidewalks, open green space, and vital preservation areas.
One of the most unique “lifestyle” perks of this development is the direct connection to the neighboring yacht club. Future residents will automatically receive memberships to the Charlotte Harbor Yacht Club, cementing the project’s status as a premier destination for boating enthusiasts.
Infrastructure and Storm Resiliency
A major focus of the Tarpon Waterfront Village Charlotte County presentation was its commitment to modern safety standards. While some concerns were raised regarding its location in the Coastal High Hazard Area, the engineering team at Morris-Depew Associates Inc. outlined rigorous storm-resiliency measures.
The buildings are designed with an elevation of 22.5 feet, a height that exceeds current “SLOSH” (Sea, Lake, and Overland Surges from Hurricanes) modeling guidelines. This proactive approach to flooding resilience was a key factor in gaining majority support from the commission.
Revitalizing a Historic Waterfront Site
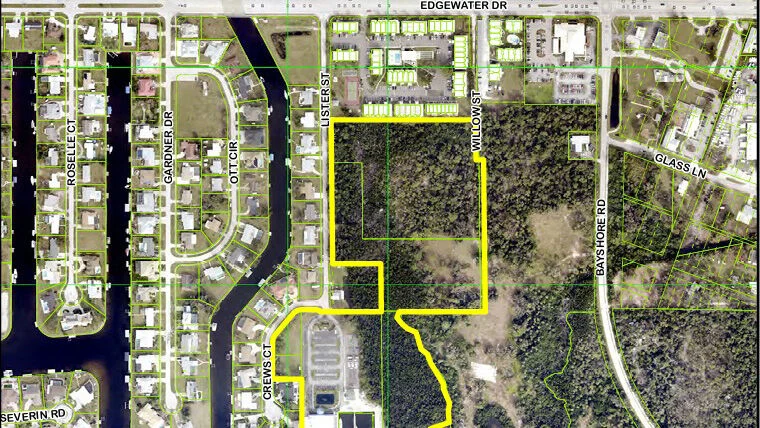
Located north of the Peace River and south of Edgewater Drive, the site has experienced a period of blight in recent years. Previously home to a mobile home park and a YMCA, the transition to Tarpon Waterfront Village Charlotte County is seen by many as a necessary restoration of the area.
By extending the Urban Service Area boundary and rezoning the land to “Revitalizing Neighborhood” and “Managed Neighborhood” designations, the county is signaling its support for high-quality infill projects that replace aging infrastructure with resilient, luxury housing.